SaaS link building
How Much Should SaaS Spend on Link Building? (2026 Guide)
The median B2B SaaS in 2026 spends $8,400 per month on link building, but median isn’t the right answer for your specific situation. The right answer depends on your stage, ARR, category competitiveness, growth ambition, and current authority position. Spending below the productive minimum for your stage produces flat results that justify cutting the channel entirely. Spending above the diminishing-returns ceiling wastes budget that would do more elsewhere. This guide gives you the framework to find your specific productive range, with real benchmark data from 200+ B2B SaaS companies in our 2026 sample.
The honest answer in three sentences
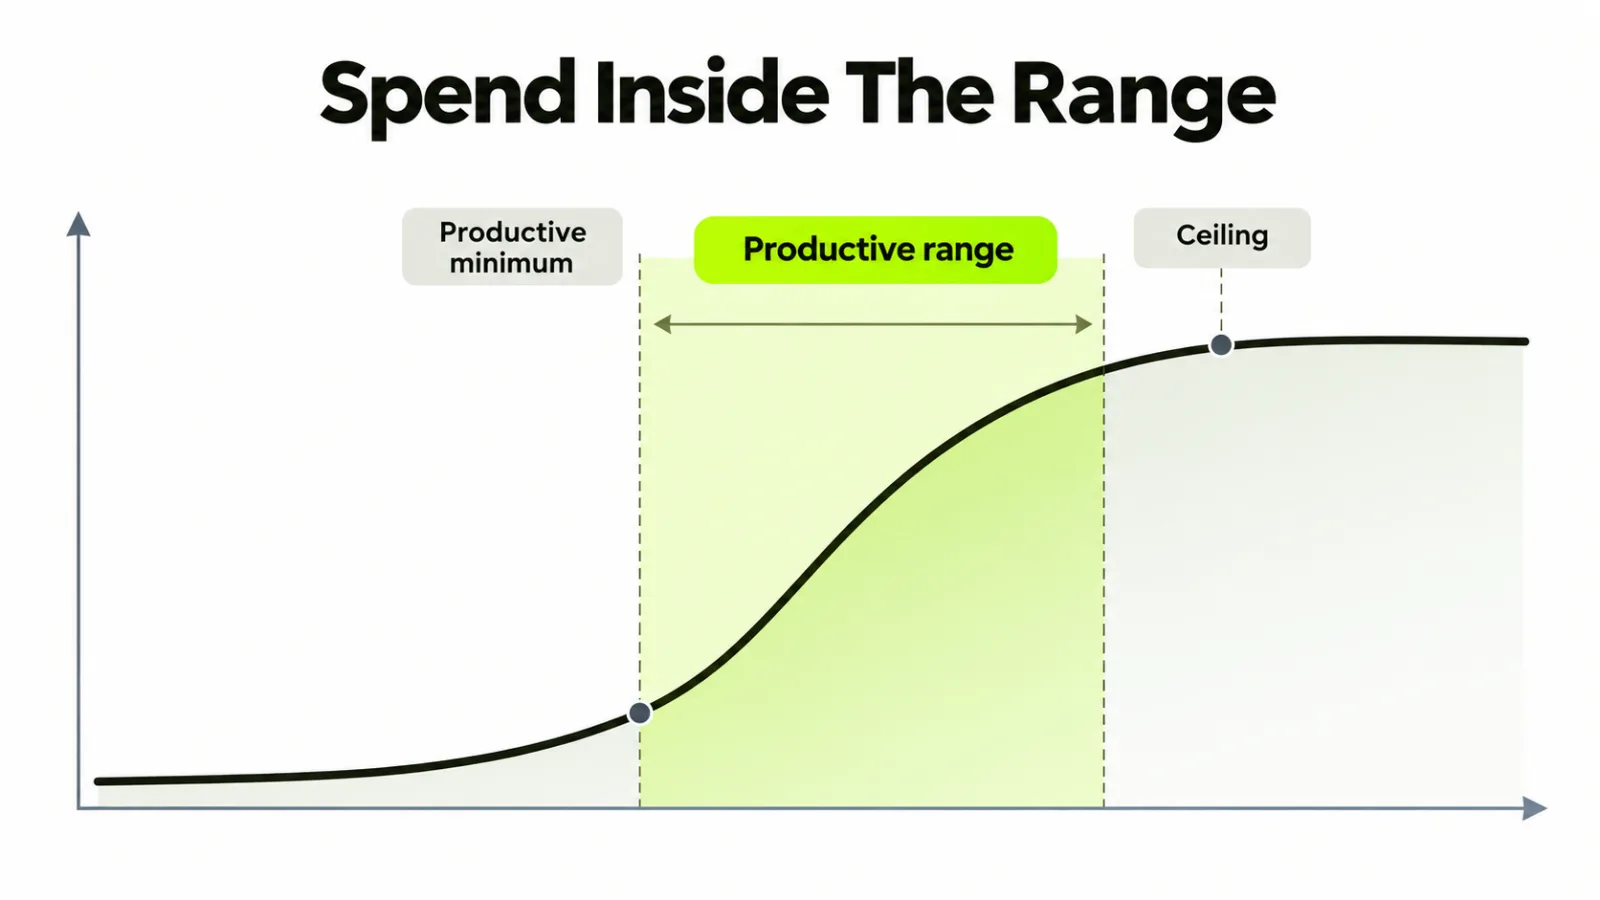
For a typical Series A B2B SaaS in a medium-competition category, the productive range is $5,000-10,000 per month. For Series B, it’s $10,000-20,000. For Series C+, it’s $20,000-50,000+. Below the productive minimum, results are too small to justify the channel. Above the productive ceiling, additional dollars buy diminishing returns and would do more in other marketing channels.
The productive minimum at each stage
The “productive minimum” is the spend level below which link building can’t pay off because there’s not enough budget to cover both quality acquisition AND strategy AND AEO/GEO AND measurement. Below this threshold you’re either getting cheap fulfillment (low-quality links) or missing essential workstream coverage.
Pre-seed/Seed: Productive minimum is $0. Don’t spend on paid link building at this stage. Founder time on Reddit, Quora, LinkedIn, and own-blog publishing produces better returns than $1,500/month on productized vendors.
Series A: Productive minimum is $5,000/month. Below this you can’t afford both real strategic agency support AND foundational AEO/GEO work AND quality link acquisition. You’ll get one of three and miss the cumulative effect of having all three.
Series B: Productive minimum is $10,000/month. Below this you can’t access tier-one PR or sustain a measurement cadence sophisticated enough to optimize. You’ll get good results but not category-leading ones.
Series C+: Productive minimum is $20,000/month. Below this in a mature category, your competitors are outspending you and capturing share faster than you can get back to parity.
The diminishing-returns ceiling
The “diminishing-returns ceiling” is the spend level above which additional dollars produce less gain than they would in other channels. Above this ceiling, your link building budget is producing real outcomes but at lower marginal ROI than alternative uses.
Series A: Diminishing-returns ceiling around $10,000/month. Above this you’re paying enterprise-tier pricing for outcomes that are constrained by your domain’s still-limited authority base. Better to wait until you grow the base before increasing investment.
Series B: Ceiling around $20,000-25,000/month for most categories. In highly competitive categories the ceiling sits higher because the marginal dollar still earns competitive parity rather than diminishing returns.
Series C+: Ceiling around $40,000-50,000/month for most categories, with exceptions for hypergrowth strategies where additional spend buys category dominance worth the diminishing per-dollar returns.
How category competitiveness shifts the math
The above ranges assume medium-competition categories. Adjust as follows:
Emerging or low-competition categories: Stay at the lower end of the productive range. Excess investment doesn’t produce better outcomes because competitive pressure isn’t there. Save the freed budget for content velocity or other channels.
High-competition categories (CRM, marketing automation, sales tools, project management): Push toward the upper end of the productive range. Competitors are spending hard and authority builds through competitive intensity. Under-investing here cedes share permanently.
Regulated industries with high editorial standards (fintech, healthtech, govtech): Lower velocity but higher per-link cost. Spend might be similar absolute dollars but you’re acquiring fewer links at higher quality.
How to calculate your specific productive range
Step 1: Identify your stage range from the section above.
Step 2: Adjust up or down 30 percent based on category competitiveness.
Step 3: Validate against your ARR. Link building budget shouldn’t typically exceed 8-12 percent of total marketing spend for B2B SaaS, and total marketing spend shouldn’t exceed 20-40 percent of ARR depending on stage. If your link building recommendation exceeds these ratios of your ARR, adjust the budget down to fit broader marketing economics.
Step 4: Validate against your goals. If you’ve identified organic as a primary growth channel, push to the upper end. If organic is tertiary, stick to the lower end.
Step 5: Run the ROI calculator with your validated budget to confirm the math projects defensible outcomes for your finance or board conversation.
What the right spend looks like vs the wrong spend
Right spend produces: integrated workstreams (link acquisition + PR + AEO/GEO + measurement) running together; senior strategist involvement on monthly basis; quality threshold maintained on all placements (DR60+, real publications, topical relevance); measurable pipeline attribution to organic by month 9-12.
Wrong spend produces: high link counts without quality; productized fulfillment without integrated strategy; AI search optimization missing or treated as add-on; reporting that shows “delivered links” without showing ranking and pipeline impact.
The over-spend warning signs
Diminishing returns become visible when: monthly investment increases by 50 percent and outcomes increase by less than 20 percent; placements feel forced or low-relevance because high-quality opportunities are being exhausted; agency proposes more frequent placements at the same quality bar but the marginal ranking impact decreases; competitor analysis shows you’ve passed parity with main competitors and additional spend isn’t producing further share gains.
The under-spend warning signs
Under-investment shows as: ranking improvements stall after 6 months; AI citation appearance is flat or declining; competitors are pulling ahead in monthly authority growth metrics; pipeline contribution from organic plateaus rather than growing.
Frequently asked questions
Should link building budget be a percentage of marketing spend or a fixed amount?
Fixed amount based on stage, validated against marketing economics ratios. Percentage thinking doesn’t capture the stage-specific dynamics.
What if I can only afford half the recommended budget?
Start at half. Build foundational authority that pays off. Increase as soon as the budget allows. Partial investment pays off; zero investment doesn’t.
How does AI search work change the spending math?
AEO/GEO work has lower marginal cost than traditional link acquisition. A reasonable approach is to allocate 20-25 percent of your link building budget to AEO/GEO work specifically. It produces outsized returns relative to the dollar share.
Is there a budget level below which link building is just wasted?
Yes. Below $3,000/month total in 2026, the work won’t pay off enough to move organic as a channel. Better to skip paid link building entirely and focus founder time on community presence (Reddit, Quora, LinkedIn) instead.
Related reading and tools
- Link Building Budget Calculator
- Link Building Budget by SaaS Stage
- State of SaaS Link Building 2026
- Our pricing tiers
- How to Calculate Link Building ROI
- ← Back to All Free Tools
Want a specific budget recommendation based on your stage, category, and authority position? Book a strategy call for a customized analysis.